 01
01PRODUCTION CONTEXT
When output changes, the energy story changes.
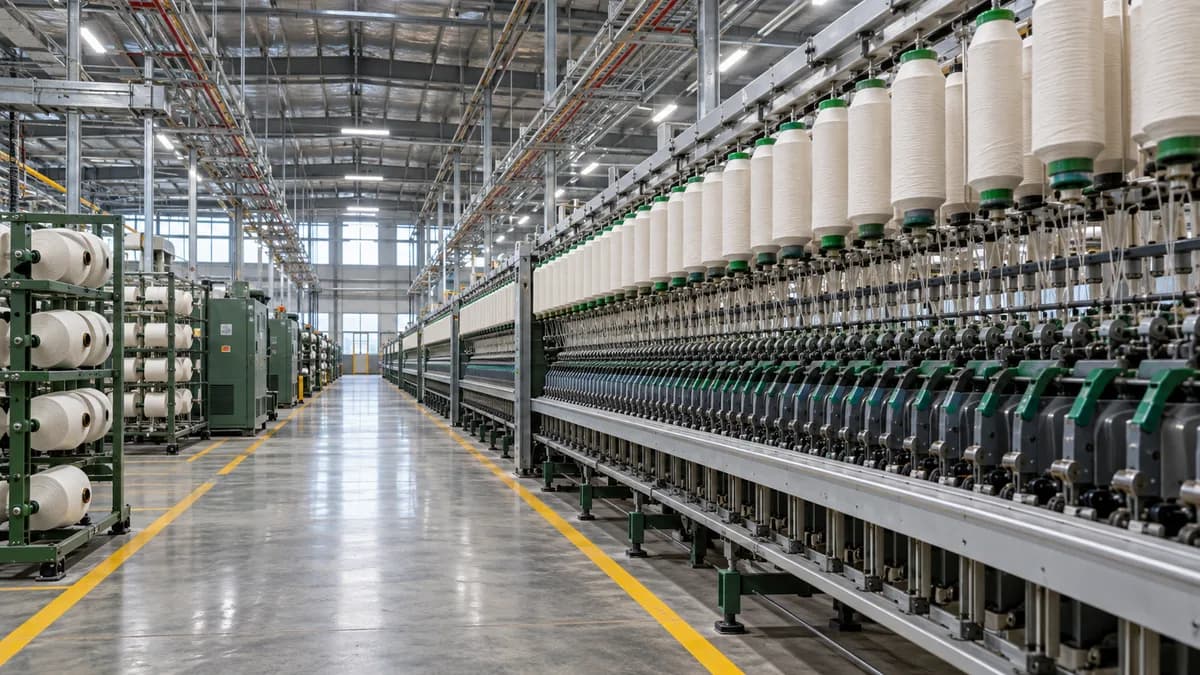
Compare energy against accepted production, shifts, and product context so a higher reading does not become a false conclusion.
Explore capabilityEnervtek connects plant energy and production data so your team can spot changes, investigate losses, and make better operating decisions.
Grid, solar, and selected meters enter the same time window.
Source and freshness stay attached to each reading.
Energy bills, meter readings, machine alarms, and output reports each tell part of the story. A plant team needs to see what changed, where it began, and how it relates to production.
Each step narrows the question. Hover, focus, or select a step to explore the workflow.
Site-specific data. Engineer-reviewed findings. An outcome the team can evaluate.
See the pilot processEvery view depends on the feeds available at the site and the question being investigated.
01Compare energy against accepted production, shifts, and product context so a higher reading does not become a false conclusion.
Explore capability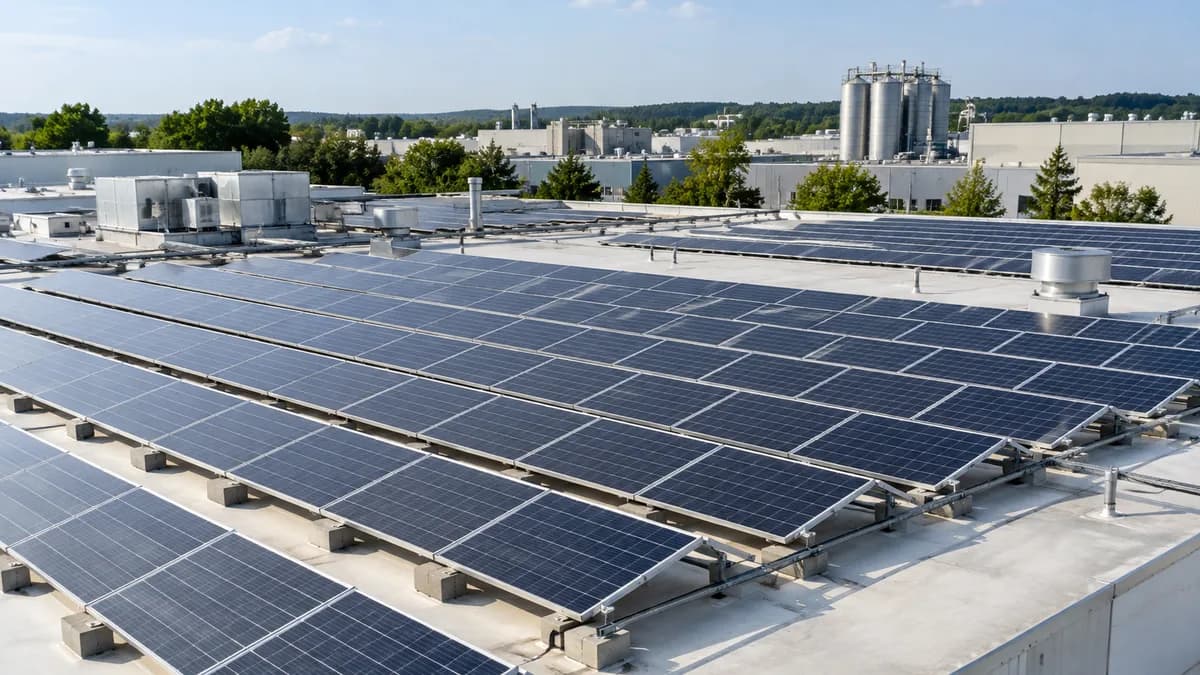 02
02Place accessible import and generation feeds on the same timeline, with units, timestamps, and clear data gaps.
Explore capability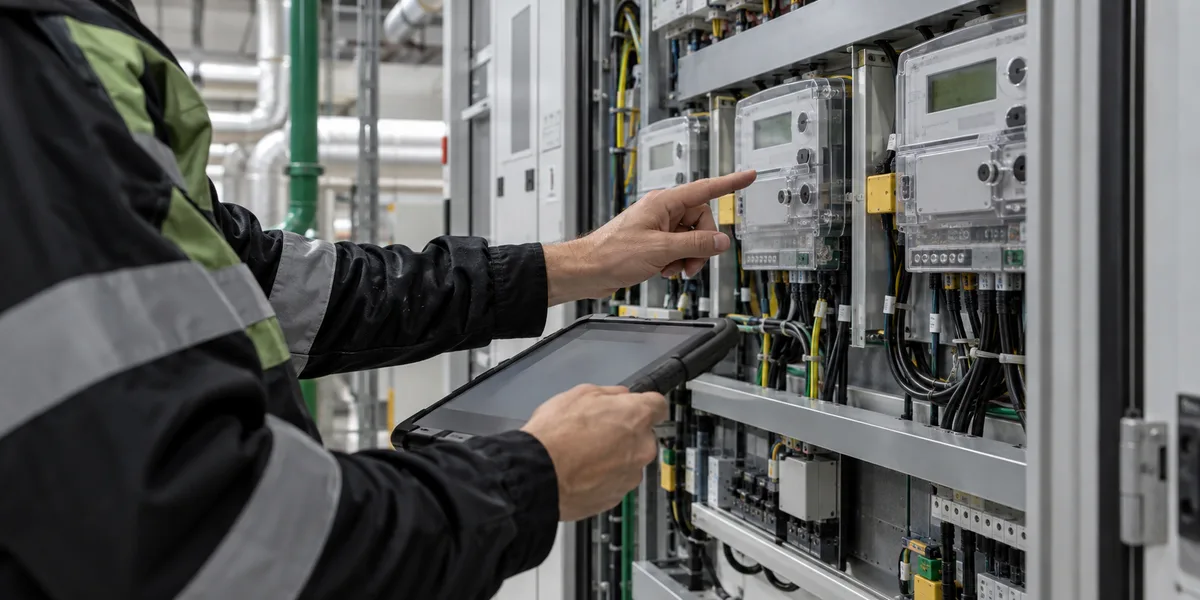 03
03Bring meter readings and nearby events to plant engineers, then record what they found and what happened next.
Explore capabilityThe same time window can connect supply, production, and equipment events. Select a signal to see its role in an investigation.
Import and demand, where a suitable feed exists.
Illustrative scenario · Demo data · No customer site represented
Energy per good unit rises while output stays steady. This is a cue to compare similar shifts, meter changes, and nearby equipment events.
Hover a card to see what each role needs from the same traceable record.
A pilot defines available data, the measurement boundary, a baseline, and one success metric with the plant team. Findings are reviewed by engineers and documented with their limitations.
Explore the pilot processThe details depend on site systems, access, and the operating question.
No. A pilot starts with the systems and records already available. Additional commercial sub-meters may be considered only where they answer a valuable question.
No. Metering coverage should match the investigation. A site, line, or selected major load can be a useful starting point.
Potentially, when accessible generation and grid data exist. The pilot review determines what can be connected and compared reliably.
No. A pilot tests whether the available data helps the team make and measure a better operating decision.
The site and Enervtek team agree which records are needed, who may access them, and what can be shared before a pilot begins.
Start with one site, one question, and a measurable outcome.